Previous article
US elections: what history says about the S&P 500, and why the Fed and AI matter more than the vote
Economy
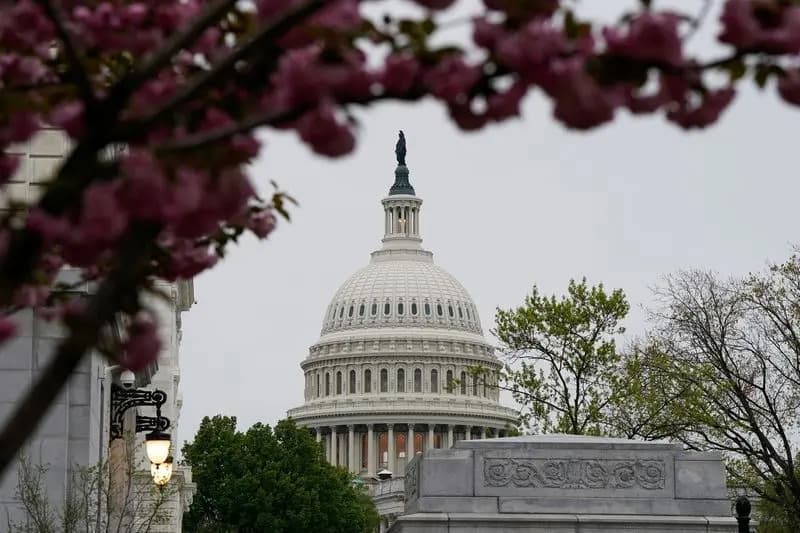
Today, November 3, the United States holds its midterm elections. According to CNBC, history suggests that the stock market generally performs well following such elections.
Data from 1980 to 2024 shows that, on average, the S&P 500 index gained 13.7% in the year following a midterm election and 13.8% after a presidential election—with positive returns in 91% of cases. In fact, the index rose over the subsequent year following every one of the 11 midterm elections that took place between 1982 and 2022.
In the short term, the outlook is less consistent: following both types of elections, the index saw an average gain of 0.2% after one day and one week, and 1.1% after one month.
The market typically favors a "divided government"—a scenario where one party holds the White House while the other controls at least one chamber of Congress. Following 10 midterm and 5 presidential elections that resulted in such a split, the index grew by an average of 15% over the following year, with positive outcomes in 14 out of 15 instances. By contrast, when a single party held control, the average gain was 11.5%.
"If you get a massive 'red wave' or a big 'blue wave,' the market doesn't actually like that very much, because it leads to an excess of one-sided spending and too much concentrated power," said Ryan Detrick, chief market strategist at Carson Group. Situations where Democrats controlled both chambers of Congress under a Republican president—a scenario that could potentially unfold following Tuesday’s elections—have also historically yielded positive outcomes. In three such instances (1986, 1990, and 2006), the index saw an average decline of 0.5% on the day following the election, but subsequently gained 3.4% over the following month and 10.9% over the following year.
However, elections can coincide with other factors that carry greater weight for the market. Following the 2000 elections, the index fell by 22.1% over the course of the year, driven by the dot-com crash—the worst post-election performance since 1980. Conversely, the best performance occurred after the 2020 elections, with a 38.3% gain as the market recovered from the pandemic-induced sell-off. According to Société Générale, Federal Reserve policy and the corporate earnings cycle are ultimately more significant than elections; for example, after the 2018 midterm elections, the index declined—as the Fed raised interest rates four times, leaving the S&P 500 down 6.2% for the year—though it was 11.7% higher a year later.
Currently, the primary driver is artificial intelligence and the question of whether the decline in tech stocks will persist. As long as the AI momentum continues and the economy keeps growing, "this bull market is likely still alive and well," suggests Detrick. Yet, a Democratic sweep of both chambers would almost certainly put pressure on the development of AI infrastructure and could lead to further pullbacks. The bond market is also showing signs of unease: yields are rising globally, France is facing a mini-debt crisis, and the conflict with Iran could intensify post-election—either through Trump carrying out threats of new strikes or through an escalation by Iran. "Seasonality is not destiny, and the concerns surrounding Iran, AI, and France will not simply vanish into thin air," wrote Jim Reid, Head of Global Macro Research at Deutsche Bank.
How has the S&P 500 performed in December over recent years?
Over the past decade, December returns have been essentially flat: the average change was approximately +0.05%, with a median of about +1.40%, and the index posted gains in 6 out of 10 years. The overall result is dragged down by two dismal Decembers—2018 (−9.18%) and 2022 (−5.90%). The picture for the last three years has been mixed: +4.42% in 2023, −2.50% in 2024, and −0.05% in 2025.
And what about the "Santa Claus rally"? Defining this window as the period from the market close five trading days before the end of December through the second trading day of January:
The index rose during this period in 7 out of the last 10 years, with an average gain of about +0.48%. All outcomes fell within a range of −0.9% to +1.4%, indicating a rather modest effect. The strongest performance occurred during the 2021–22 period (+1.43%), and even starting from the December sell-off in 2018, the index managed a gain of 1.29%. The last three instances, however, have been weak: −0.88%, −0.53%, and −0.11%.